Wednesday, April 01, 2015

Literacies for the digital age: Tool literacy

This is the eighth in a series of blog posts highlighting the digital literacies our students will need to succeed.  This post will provide you with some ideas on how to help students attain the tool literacy skills they need.

TOOL LITERACY
Tool literacy, the ability to manage and create information, is all about using software tools to help support the other literacies. This is sometimes called computer literacy or technology literacy.
Managing information using online tools in a digital space is an important skill. Here are some quick tips that can help students (and you) manage their information overload using Web clipping tools, curation tools, RSS and newsreaders, and synchronous communication and backchannel tools.
One way to keep student’s information organized is for them to use Web clipping tool such as Evernote. Evernote runs on desktops and via an iPad and Android app, and allows the student to take notes, record audio files, insert images, and much more, and the notebooks with the information remain synced across all their devices. Classroom ideas: Evernote for educators Livebinder
There is a clipping tool made especially for schools. It is called EduClipper and it has been developed by Adam Bellow of EduTecher.  The created EduClip boards are easily shared and there is an iPad app, tool. Classroom ideas: Creating digital portfolios with Educlipper
Many educators use Pinterest, for their Web clipping tool, which works with the browser, iOS devices, and Android devices. Classroom ideas: 37 ways teachers can use Pinterest in the classroom
One iPad app I have started using is Pocket, which downloads the items I add to it. This is a great way for students to have hard copy of what they have found. It works on computers, iOS, and Android devices.Classroom ideas: How to use the Pocket app for classroom research
Pearltrees is an online curation and organizational tool and an iPad and Android app with a social component. You can search, link to other’s pearls, and organize your own into meaningful areas for you. Classroom ideas: Visual social bookmarking with Pearltrees
One tool that I have been using for a lot of years, and that has now been released for many platforms, is Microsoft’s OneNote. With the ability to easily create notebooks, add images, text, embed files, and draw, OneNote is now my tool of choice for keeping myself organized and for curation across all of my devices. Classroom ideas: OneNote for educators Pinterest page
RSS, or Really Simple Syndication, is a very important tool for students.  RSS allows the user to gather (also called aggregate) many of their data sources in one place. The tool that gathers the information in one place is called a newsreader. One of the most popular newsreaders is Feedly. Feedly has plug-ins to the major Web browsers and an iPad and Android app, too. Classroom ideas: Using RSS in the classroom

RSS can be used for many purposes to support teaching and learning as well as personal items of interest. It saves the student the time to visit that blog or news site or even Twitter and has all of the information just flow into their newsreader. I love this video by wydea which explains RSS in a practical way!


Students should also become proficient with real-time audio and video conferencing, collectively called “synchronous communication”. Both Skype and Google+ Hangouts are samples of that. And this can be done via a tablet, too. Classroom ideas: Skype and Google+ Hangouts
Knowledge of some simpler online tools to use as a backchannel or a planning space is useful for students to know. I asked my Twitter PLN to post to a TodaysMeet page with some ideas of how students might use it for planning. Classroom ideas: 20 ways to use TodaysMeet in the classroom
And, an old favorite, Wallwisher, has reinvented itself as Padlet. It works perfectly as a backchannel tool through a Web browser on a tablet or computer. Classroom ideas: Interesting ways to use Padlet in the classroom
81Dash is another backchannel tool and is intended for education. You can create rooms and open them when you need them and even have a conversation in the room. Classroom ideas: Backchannels in the classroom
What tools do you use to support tool literacy? Let us know on Twitter! #kathyschrock

Sunday, March 01, 2015

Literacies for the digital age: Information and digital literacy

This is the seventh in a series of blog posts highlighting the digital literacies our students will need to succeed. This post will provide you with some ideas on how to infuse information literacy and digital literacy skills into the curriculum.

INTRODUCTION

Information literacy forms the foundation for all of the other literacies. Students need to know how to state their information need, search for it effectively, evaluate what they find for validity, and utilize the information they find.

There are many information literacy models available and many include a component of the best ways to conduct research on the Web. Let’s look at one of these processes.
In order to begin their research, students need be able to ask the right question. Of course, the overall context of the research will be determined by the unit being studied in class, but there are some standard information literacy steps students can use to develop the query they will research in order to gather their information.
  • Students should create a list of keywords about the topic
  • They should then create a question that is not too broad or too narrow.
  • Students should list the places for gathering their information. This may include the the Web, subscription databases, or experts in the field.
  • They should conduct some cursory research to make sure there will be information available for their topic.
  • If necessary, they should re-work their question.
  • Once they begin the research in earnest, students need to become familiar with the critical evaluation of information in order to determine the credibility, validity, and authority of the information they locate.
  • Students also need to gather their assets and remember to cite their sources
  • NoodleTools has a wonderful flowchart-like, hyperlinked page, Choose the Best Search for Your Information Need, which allows students to consider the type of thing they are looking for (i.e. controversial topic, background information, primary sources, etc.) and leads them to specialized search engines and directories to use.
ESSENTIAL QUESTIONS

The development of the essential question that will guide the student through the research process is also an information literacy skill. How do you engage students with questions and, at the same time, encourage them to think about using this technique when determining their information need?
Grant Wiggins describes what an essential question entails in an article on his Authentic Education site. Wiggins states essential questions…
  • cause genuine and relevant inquiry into the big ideas and core content
  • provoke deep thought, lively discussion, sustained inquiry, and new understanding as well as more questions
  • require students to consider alternatives, weigh evidence, support their ideas, and justify their answers
  • stimulate vital, on-going rethinking of big ideas, assumptions, and prior lessons
  • spark meaningful connections with prior learning and personal experiences
  • naturally recur, creating opportunities for transfer to other situations and subjects
Teaching students how to develop an essential question to articulate their information need can help.  ASCD offers a chapter from the McTighe and Wiggins book, Essential Questions: Opening Doors to Student Understanding, on their site which provides a practical way for teachers to learn the best ways to create these questions, and can help you explain the process to students.
Having students look at samples of essential questions can be useful, too.  Here are some resources to help.
SEARCHING TIP

There is one thing about Google search that has changed and you should make students aware of. In 2011, Google began giving you results based on some of your searching habits. To avoid that aspect, you should have students conduct a verbatim search. Here is how they can do this.
Once a user conducts a search, they need to click on SEARCH TOOLS – ALL RESULTS – VERBATIM and the search is refined to include all of the results, not just those tailored to searching habits.

CRITICAL EVALUATION

The skill of learning how to evaluate information is a practiced one. Once students look at information with a critical eye, using a form or online tool, they begin to internalize the things they need to think about.
I have come up with these five over-arching questions.
  1. Who wrote the pages and are they an expert?
  2. What does the author say is the purpose of the site?
  3. When was the site updated and last created?
  4. Where does the information come from?
  5. Why is the information useful for my purpose?

And here is an expanded version of the “5 W’s of Website Evaluation” that you can print out and put up in your classroom or put on your blog!

I have also created evaluation sheets for all levels that students can use when beginning the process of looking at Web sites with a critical eye. Those forms and many additional resources can be found on my Critical Evaluation page on the Kathy Schrock’s Guide to Everything site.

LOCATING IMAGES

The Creative Commons project has helped immensely with the ease of finding images that can be used in a research report or project.  The Creative Commons project allows content producers to explicitly state how their content may be used. These creators make a determination of whether their asset may be used commercially or just non-commercially, can be transformed into a new product by someone else, and, if they allow transforming of their work, the creators can also require the person who made the changes to apply the same CC license to their new creation and allow others to edit the new work.
When creators upload images to Flickr or a video to  YouTube, they can pick the combination of permissions they want to allow for the use of their creation, and the Creative Commons license is published. Here is what a sample license looks like:

The Creative Commons site has a search engine that allows students to search by license terms, but the three places that students usually search for information and images — Google, Flickr, and Bing — now also have Creative Commons-licensed image searching built right in. It works pretty much the same way in each of these tools.

CITING SOURCES

Once students find credible and reliable information and Creative Commons-licensed images, and save these to utilize in some way, they have to become experts at citing where they obtained their information.
You can review the many sites for both learning how to cite the new materials as well as the tools that make this easier. One of the best is the Purdue Online Writing Lac (OWL) which includes research paper and citation formatting for the three popular citation systems.
There are also some great online citation creators which both take the students step-by-step through the process as well as port the citations to the student’s desktop. My top favorite tools for this are bibmeEasyBibWritingHouse and Son of Citation Machine.

DIGITAL LITERACY

Digital literacy skills involve using the digital technologies, the communication tools, and networks to find, evaluate, use, and create information. One of these skills that I feel is the most important for students is the use of the communication and collaboration tools, commonly referred to as “social networking”.
The online collaboration skills are not much different than the in-person collaboration skills we help students develop. There are some great rubrics dealing with collaboration which can be used with students. Here is a portion of one from the University of Wisconsin- Stout collection.
The student who is a good collaborator:
  • Stays focused
  • Demonstrates and encourages effort
  • Follows through
  • Is a “good” group member
  • Gathers research
  • Looks for solutions to problems
  • Has a positive attitude
As an educator, gauging mastery of these collaboration skills is a bit more difficult in the online world than in the classroom setting. You will probably want to be a virtual partner in every online group, ask students to save a transcript of their discussions (which they can easily do in Today’s Meet) and share it with you, have students use hashtags to keep their group’s comments together, and monitor the revisions  in a Google document. I have a collection of both collaboration rubrics and posting rubrics on this page, if you are looking for some additional ones.
Students also need to be reminded, when collaborating and contributing to a school-based social network, to “pay it forward” and share good ideas with others, post often and don’t just lurk, be a productive member of the network by adding and building upon the content of others, think of the possible consequences before they post, and provide either positive or neutral feedback to others. I firmly believe that negative feedback does not belong in a group social network. That does not mean a student cannot give another student constructive, negative feedback or strongly disagree. However, my preference is that this is done in a one-to-one manner, such as a face to face conversation, an email, an IM, or a direct message in Twitter.
What tools do you use to teach information literacy? Let us know on Twitter! #kathyschrock

Saturday, February 07, 2015

Review: STM Aero and Equil Smartpen 2

I recently acquired two new tech accessories I want to share with you!

STM Aero Small Laptop Backpack

I was able to take a look at this laptop backpack at the FETC15 conference in Orlando last month. After examining it, I realized this laptop backpack was one that would work for me! Here are the features I love, in order of importance to me when traveling:
  • SIZE: The STM Aero is intended for a 13" laptop, but I only need room for the 11.6" MacBook Air. Many backpacks sized for 13" laptops are big and bulky. This one is not! The outer dimensions are only 16.14 x 10.24 x 5.51 inches. The laptop device space is 9.05 x 12.8 x 0.98 inches, which will fit up to a 13" MacBook Pro Retina. In addition, is very lightweight at 1.5 pounds when empty! It comes in Berry red, black, and gray. (I opted for black since it does not show the dirt!)
  • IPAD: I wanted a dedicated pocket for my iPad Air 2, and this bag includes a nicely lined one of these, too.
  • BAGGAGE LOOP: The back of the STM Aero includes a luggage handle pass-through on the back to make it easy for me to carry it on top of my roller bag when I need to.
  •  KEY STRAP: One thing I always worry about when traveling is misplacing my car keys. The STM Aero includes a strap and hook for attaching my keys!
  • INSIDE SPACE: The STM Aero is not very deep, but I can easily fit my technology accessory bag with the adapters, power supplies, extension cord, and additional items in the space.
  •  SIDE POCKETS: I often carry a water bottle, so a side pocket is a necessity for me. This backpack has 2 side pockets, so I am using the other one for easy access to my in-ear headphones.
  • STRAPS: The STM Aero has comfortable, padded shoulder straps and back, and also includes a "sternum strap" that connects the straps in the front in case I am carrying a heavier load. There is a grab strap at the top of the backpack which makes it easy to carry down the plane aisles.
  • FRONT POCKETS: The STM Aero has a zippered, soft-lined pocket on the front which includes two slip pockets (one that I use for my iPhone 6+ and the other for my Wayfarers) and I store my boarding pass in the larger section for easy access to it.
  • INSIDE POCKETS: Inside the STM Aero, there are three more slip pockets, two pen slots, and a deep zippered pocket. 
I marked up some STM Aero images so you can view the components I included in the review.


When fully loaded, the STM Aero Small Laptop Backpack retains it shape and is very comfortable to wear. If you need more space for your items, check out the larger laptop bags and rollers on STM's site!


EQUIL SMARTPEN 2

I know we already have iOS and Android devices with drawing tools and external art/drawing tablets. And there are electronic pens that can collect your notes and send them to your computer when you use special notebooks for taking notes.

I had read some reviews about the Equil Smartpen 2 and thought it hit the sweet spot for both notetaking and drawing in a more traditional way.

The Equil Smartpen 2 includes a reciever that you clip to any piece of paper, pad, or notebook, a regular size pen, and extra pen tip, and a cool case for carrying and charging.

Equil Smartpen 2


As you are drawing or writing, and you are connected via Bluetooth to your Mac or Windows computer or iOS device, what you are drawing is transferred in real-time to the computer or iOS or Android device. You can then turn handwriting into text if you want to on the computer or tablet. It is easy to begin new "virtual" pages by pushing the button on the receiver. The receiver can hold 4 GB of information.


Real-time transfer of drawing to tablet


There are two apps for the Equil Smartpen 2 for the iOS and Android devices - Equil Note and Equil Sketch - one for writing and one for drawing. I think the drawing app is a paper-based sketchnoter's dream come true! (Equil Note is also available for the Mac and Windows platforms.) 

You don't need to be Bluetoothed to a device when you are taking notes or drawing. You can simply use the pen and the small receiver, which will collect the information, and send it to your computer, tablet, or phone later. (This saves some battery life, since the BT connection can be shut off on the receiver while you are writing/drawing.)

The notes are synced across your devices using iCloud, Dropbox, or Evernote and also share with social media.


I can't seem to locate a stylus tip for the pen to use with the iPad as shown in the video. (Perhaps that was scrapped during development.) You can find out more about the Equil Smartpen 2 on their site!


Sunday, February 01, 2015

Literacies for the digital age: Data literacy


This is the sixth in a series of blog posts highlighting the digital literacies our students will need to succeed. This post will provide you with some ideas on how to infuse data literacy skills into the curriculum.

According to Dr. Milo A. Schield, students must be able to read, interpret and evaluate information. They must also be able to analyze, interpret and evaluate statistics. And they must be able to gather, assess, process, manipulate, summarize, and communicate data.
These three skills collectively comprise data literacy.
One way to have students gain the data literacy skills is the student creation of an infographic as a creative assessment. This assessment process includes practice with the information, visual, and computer tool literacies, too.
An infographic is a visual representation of data that allows the viewer to understand a topic, get another view, or persuade them to research further.
In the Newspaper Designer’s Handbook, a McGraw-Hill publication by Tim Harrower and Julie Elman, they provide some thoughts on why one might use an infographic. They are writing about infographics to enhance a news story, but the same ideas are applicable to student-created infographics to support a research project.
  • To complete the “story” for those who are interested
  • To draw in viewers from those that might skip the information
  • To pull out salient numbers, details, and comparisons
  • To clarify with statistics, geographical detail, or trends
  • To help insure the viewer “gets it”
Infographics fall naturally into categories such as statistical infographics, timeline infographics, process infographics, and research-based infographics.

STATISTICAL INFOGRAPHICS
Statistical infographics contain an overview of a topic and data to support the content. These infographics are used to either inform or persuade.
Pouring in your cup
Statistical infographic


For elementary students, showcasing statistical infographics which use size to indicate the different percentages instead of numbers would be easier for them to replicate.


For elementary students, showcasing statistical infographics which use size to indicate the different percentages instead of numbers would be easier for them to replicate.


TIMELINE INFOGRAPHICS
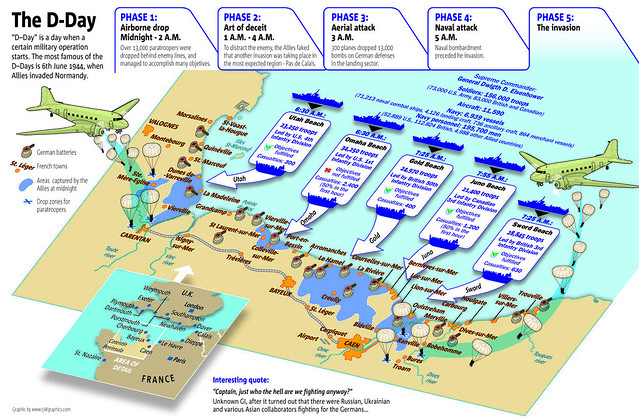
One way to get students “hooked” is to showcase infographics that engage them, like this timeline infographic that tells a story.

Normandy invasion
Timeline infographic 2


PROCESS INFOGRAPHICS
A process infographic is a little different from a timeline. The creator adds a branching component to the visualization. A process infographic could be used when students are creating “how-to” essays. The infographic can be created by the student writing the essay, or a partner student can design the infographic from the essay.


RESEARCH-BASED INFOGRAPHICS
One of my favorite types of infographics is the research-based infographic. Students are given a sum of money and have to conduct research to determine how to raise those funds. Snagajob.com published the infographic below and, although they did not include where the data was found, they did include fairly comprehensive overviews of how they determined the statistics.

Here is the explanation for one of the items included in the infographic above: “Peyton Manning makes $14 million per year. Super Bowl notwithstanding, in the 2009 regular season he completed 4,500 passing yards (totaling 162,000 inches). If you divide his salary by the number of passing inches, he would need to pass the ball a little more than 8.4 inches to make $729. And just in case you’re wondering, a football is 11” long.”
There is a new series of research-based infographics called “If the world were a village of 100 people” created by Toby Ng. These data-based infographics are simple and informational, but are very compelling.

DATA VISUALIZATION
To learn how to process data, students should view already-created visualizations and discuss how and why the data is presented the way it is and its relevance.
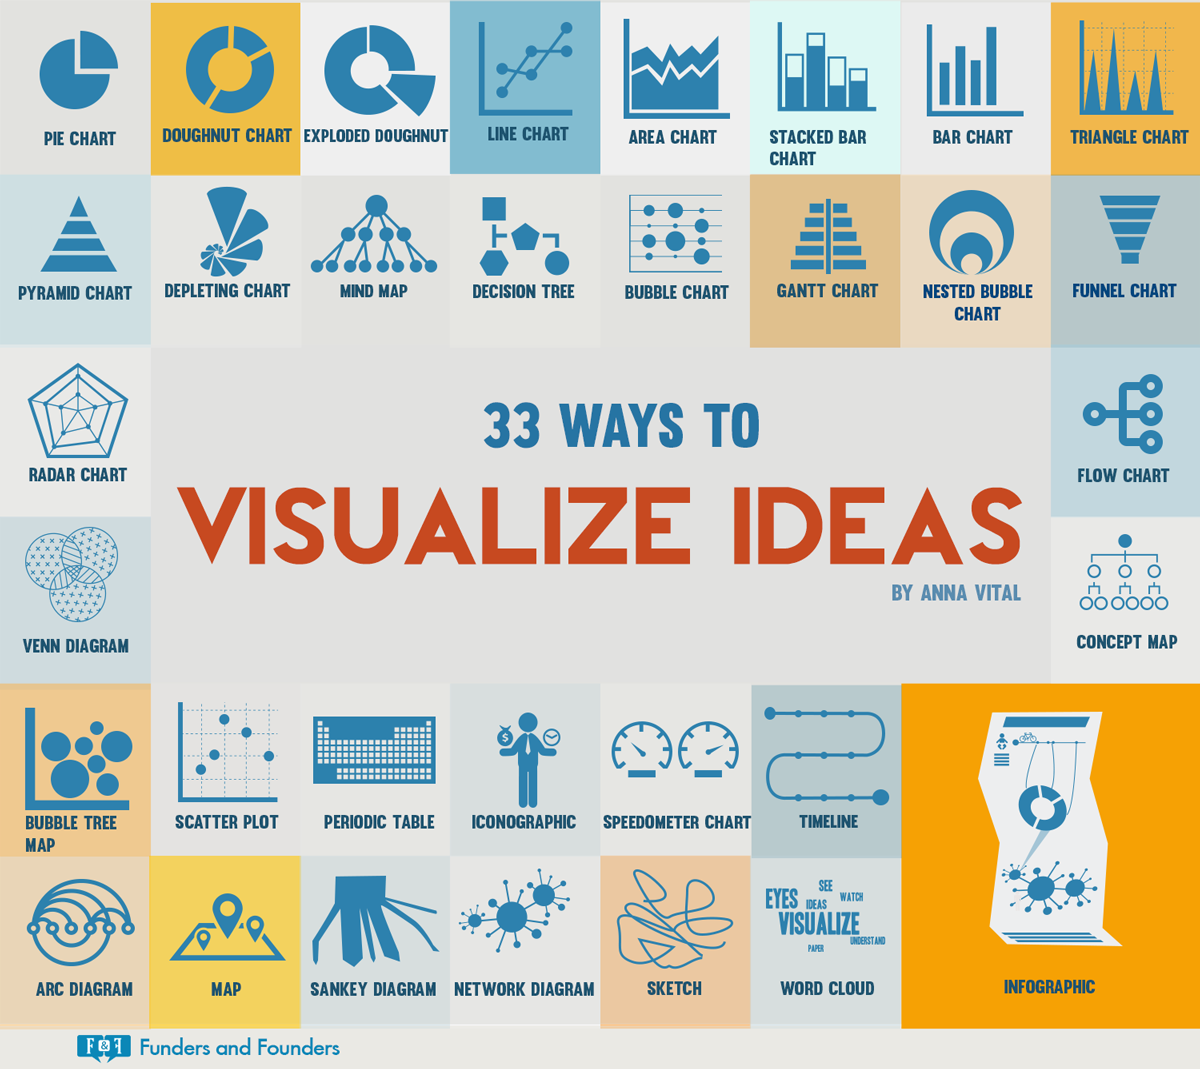
This great infographic provides an overview of some visualization options.


One good place for teachers and students to learn how to pick the most effective visualization for the data is Hans Rosling’s Gapminder site. The Gapminder site has a teacher area with samples, ideas, and curriculum to support the teaching of these skills. There are instructional videos and PDF downloads for both teachers and students.
Another site to support students learning how best to visualize data is Google’s Public Data Explorer.

CREATING THE INFOGRAPHICS
There are many apps and tools that can help students create their infographic. Something as simple as a Microsoft PowerPoint, Apple Keynote, or Google Drawings single slide or page can be used. Once the infographic is created on a single slide, the slide can simply be saved out as an image and easily shared.
There are many online sites that provide templates for infographic creation. Some are paid sites that provide a few free templates. However, according to Eric K. Meyer, the author of what I consider the best book about infographic creation, a good infographic should have a beginning, a middle, and an end. He likens the visual elements in an infographic to those in a new story’s headlines and lead.
In addition, he goes on to state most readers skim both text and images rather than reading them, so a well-crafted visual image at the top of the infographic may just be the hook the viewer needs to stop and take the time to read and look at the information in the infographic. He talks about the way people read an infographic as an inverted pyramid style with the main point at the top followed by secondary points and supporting details. He also states any text in the title of the graphic should communicate facts rather than just label the information.

The templates offered by the online infographic creators do not often follow this tenet. Infographics need “weight” so the viewer knows what is most important. Many infographics I see are simply posters, with all the information equal in weight. Since an infographics is intended to inform or persuade, there does need to be a “hook” so the viewer will examine it in depth.
What is useful about the online infographic-creation sites is that a student is able to start the infographic from scratch and many, many graphical assets are included. Some of these tools even have the ability to input data directly into the tool and pick an appropriate data visualization for the project.
Online infographic creation sites
Tablet apps for infographic creation
You can find much more information, samples, ideas, and tips on my Kathy Schrock’s Guide to Everything: Infographics page. Here is a quick video overview!
What do your students use for creating infographics? What type do they create most often? Let us know on Twitter! #kathyschrock

Tuesday, January 13, 2015

Using first gen iPads in the classroom

I received a note today from a teacher who wound up with a classroom set of iPad 1's for her classroom, and she was looking for lesson ideas that would work with that "older" device. Of course, many of the lesson ideas, tips, and tricks that are on the Web for any generation of the iPad will provide a good starting point for planning, like those I have on this site, but there are some specific things to consider when using the older iPad.

There were some limitations on the first gen iPad-- it had no camera and only projected certain things through the VGA connection. Back in 2010, I asked people to add apps that would project with an iPad to a Google form. I have no idea if this is of any use now, but here is the link

The iPad first generation can run up to iOS 5.1.1, so, when looking at current lessons that use iPad apps that require a newer operating system, and doing a search for comparable apps in the iTunes App Store, look for the operating system requirements listed on the app page. It will probably take a bit of searching to find those that will work, but it will be worth it! For instance, one of my favorite iPad apps, Sock Puppets, only requires iOS 4.3. And I am sure there are plenty of good creation apps that still work with the older operating systems.


Sock Puppets only needs iOS 4.3

I also figured out if you do a Google search on "iPads in the Classroom" or "iPad in the Classroom", and limit the date span of the search from the day the iPad 1 was announced to the day when the iPad 2 was launched, the resulting series of hits will provide lots of great ideas on the use of the original iPad to support teaching and learning.

Here is how to conduct that search. Do a search in Google, pick the SEARCH TOOLS drop-down menu, pick the date area and pick a "custom date". I searched Web pages that were put up from January 27, 2010-March 2, 2011. (Of course, this does not mean there were no useful Web pages put up after that time.) I did the limited date search to find pages that could only have included ideas and successful practices for the iPad first generation.


Of course, even though the iPad first gen cannot take pictures, students can still download images and edit them using certain photo-editing apps. And there are collage apps, like CollageIt Free, that only require iOS 5.0. It takes a bit of work to find apps that will run on the older iPad, but it is not impossible. And don't forget to search for iPhone apps, which will run nicely on the iPad, too.

I came across this PC World article from 2013 that states you might be presented with the ability to download an older version of an app that will work on your older iPad device. (I don't usually have an "older" device, so do not know if this is still happening.) If it is, it would allow installation of older versions of popular education iPad apps to be installed on the first generation iPad. 

Anyone have any additional ideas for those with the first generation iPads? Are you using one or more of this generation of iPad in your classroom and would like to share the list of creation and editing apps you have on the devices? It would be appreciated and save others a lot of App Store searching time!


Thursday, January 01, 2015

Literacies for the digital age: Numeracy


This is the fifth in a series of blog posts highlighting the digital literacies our students will need to succeed. This post will provide you with some ideas on how to infuse numeracy, one of the traditional literacies along with reading and writing, into the curriculum.
Numeracy is the ability to reason and to apply simple numerical concepts. This includes, among other things, mastering of basic math, number sense, computation, measurement, and statistics. (In my grouping of literacies, I separate data literacy into its own category.)
The document entitled “Standards for Mathematical Practice” provide an extensive overview of the “varieties of expertise that mathematics educators at all levels should seek to develop in their students”. These standards “describe ways in which developing student practitioners of the discipline of mathematics increasingly ought to engage with the subject matter as they grow in mathematical maturity and expertise throughout the elementary, middle and high school years”. It is about being able to take their mathematical skill set and use higher order thinking skills to evaluate, experiment, and reason. The Standards for Mathematical Process are:
  • Make sense of problems and persevere in solving them: students analyze, conjecture, monitor and evaluate, transform, and conceptualize
  • Reason abstractly and quantitatively: students decontextualize and contextualize as well as creating a representation of the problem
  • Construct viable arguments and critique the reasoning of others: students can justify, reason inductively, and compare and defend
  • Model with mathematics: students use their math skills to solve problems in everyday life
  • Use appropriate tools strategically: students can pick the appropriate tool to help them
  • Attend to precision: students label and present their mathematics in a way that make it understandable to others
  • Look for and make use of structure: students can recognize mathematical patterns
  • Look for and express regularity in repeated reasoning: students notice when calculations are repeated and use that information
In order to develop these levels of expertise in students, educators need to be able to connect the mathematical practices to the mathematical content in mathematics instructions. There are various ways to help this happen. There are the commercial textbooks and online products that can support student mathematical understanding. There are online mathematics informational sites to provide students with another “voice” to help them understand the basics a bit better and there are stand-alone software programs and apps to provide additional practice.
I am not a mathematics educator, so do not feel comfortable recommending software and apps to support mathematics instruction. I would not know if the app was reinforcing the skills in an appropriate way. However, I have created a PDF form entitled “Critical Evaluation of a Content-Based iPad/iPod App” (which could easily be used for Android apps, too). This form provides some guidance for teachers of any subject as they examine apps and tools to support instruction.

ONLINE MATHEMATICS INFORMATIONAL SITES

As with any online material, educators should preview the elements of the site to validate the information  presented and methodologies being used.
  • MathPortal is a site, created and written by a mathematician, which includes tutorials, formulas, sample assessments, and much more for upper middle school and high school students
  • PBS LearningMedia includes material from PBS and also videos imported and streamed from Khan Academy. These videos can be searched by grade level and subject. No log-in is needed to view the videos and, since Khan Academy now requires a log-in, this site is an easy way for students of any age to access the Khan Academy videos without providing personal information.
  • The National Council of Teachers of Mathematics provides support for teachers and vets online sites and lessons for use in the classroom. They also host the Illuminations site, one of the partner content collections that were a component of the now-closed Thinkfinity portal.
  • It takes a while to comb through the plethora of links on Pinterest, but you can usually find a few gems!

What type of online math sites do you find useful? Share on Twitter! #kathhyschrock

Tuesday, December 02, 2014

HP EliteDesk 800 G1 Mini PC in the Classroom Contest

The Hewlett Packard EliteDesk 800 G1 Mini PC is a tiny desktop computer with lots of big features!

Its footprint is 6.9 x 1.3 x 7.0 inches and it weighs only 2.92 pounds, less than a lot of laptops! The HP EliteDesk 800 G1 Mini PC  has a 4th generation Intel processor and runs the newest Windows operating systems. The front of the computer includes two USB 3.0 ports (one of which is a USB fast charge port) and an audio-out and microphone jack.


Shown with optional stand, monitor, keyboard and mouse


On the back, it has an additional four USB 3.0 ports, a VGA connection, an Ethernet port, 2 Display Ports, and an audio-out jack. The bottom of the HP EliteDesk 800 G1 Mini PC has a VESA mount.

A wireless card is an option as is an external DVD/RW drive. With a 500GB standard hard drive or up to a 1TB solid state drive, the HP EliteDesk 800 G1 Mini PC packs a great computer into a "mini" package. Also, due to its small size, it has more than 3 times the energy-efficiency of a tower desktop.


The unit I received has a 2.9gHz i5 processor and is running Windows 7 Professional, but the upgrade disk to Windows 8.1 was also included in the package. It has 4GB RAM, a 128GB solid state hard drive, and the WiFi card.


Here is more detailed specs and information about the HP EliteDesk 800 G1 Mini PC.


USE IN SCHOOLS

In the education arena, the HP EliteDesk 800 G1 Mini PC can solve any number of problems as well as help schools think “out of the box”.

Teacher’s desks are notoriously cluttered with the tools of the trade…their teaching materials, stationery supplies for student use, and much more. The diminutive footprint of the HP EliteDesk 800 G1 Mini PC can free up a ton of usable space on a teacher’s desk and also eliminate the “big box” on the dusty floor! Teachers can easily get access to the USB ports and audio jacks on the front of the EliteDesk G1 Mini PC when they need to, too.

Another plus for teachers is the WiFi capabilities of the device. In the past, teachers were tied to classroom area of the Ethernet jack and VGA connection. Now, with wireless projectors and wireless network access, the HP EliteDesk 800 G1 Mini can sit anywhere in the room. In addition, with the plethora of collaborative apps that can have students share over WiFi, the teacher and students can share documents, collaborate in real-time on virtual whiteboards, and students can mirror their mobile devices to the teacher’s desktop.

In schools where security of computers in a lab setting or classroom is a concern, this tiny HP EliteDesk Mini 800 G1 Mini PC can be easily locked up at night in a drawer or closet. It does have the traditional cable lock port, but locking them up at night might be a better option.

The low cost and energy-efficiency also make this mini computer a perfect replacement for the bigger CPUs in a computer lab setting. The SSD drive makes them fast to boot up and, again, space is saved on the computer lab tables for other student project-based or reference work.

One creative idea, if students have a monitor, keyboard, and mouse at home, is to have the HP EliteDesk 800 G1 Mini PC become a school’s 1:1 device of choice. The light 2.92 lb. weight, the SSD drive which would not be subject to problems when carried in a backpack, and the built-in WiFi could allow students to bring it back and forth from school to home. In school, there would be labs of monitors, keyboards, and mice and extra sets of these in the classroom, library, science labs, and even the cafeteria!  A student would just hook-up his or her HP EliteDesk 800 G1 Mini wherever there was a “workstation” spot. 

THE CONTEST

HP graciously provided me with the opportunity to give away a new HP EliteDesk 800 G1 Mini PC to a lucky US or Canadian PreK-16 educator or pre-service or graduate education student! In order to have a chance to win the Mini PC, educators were asked to make a mini-- a mini-infographic that is!


As you know, an infographic is a visual representation of data. Having students create them as a formative or summative assessment can help them practice their information literacy, visual literacy, data literacy, and technology literacy skills.


When starting off with this type of lesson or unit, it is best to start small. Have students research to find one piece of interesting data, decide who the audience for the infographic is going to be, consider the type of data visualization that would work best to showcase the information, and then create a mini-infographic showcasing just that single piece of interesting data.


USA Today, since beginning publication, has offered a mini-infographic they call a “snapshot” on the front page of each issue of the newspaper. Researchers, reporters, and editors in each of the primary departments of News, Money, Sports, and Life account for most of the ideas and research for these snapshots. Once the research is complete, the information goes to a graphic artist who creates the infographic. This process usually take between three and four hours.


Here are some links to sample USA Today snapshots in the area of news.


CONTEST OVERVIEW (CONTEST CLOSED DECEMBER 7, 2014)


In order to participate in the contest to win an HP EliteDesk 800 G1 Mini PC desktop computer, the educator had to create a mini-infographic or “snapshot” and submit it to me. The winner of the HP EliteDesk 800 G1 Mini PC was randomly chosen from those educators who submit the mini-infographic.


The topic of the infographic had to be in their content area, an education or educational technology-related topic, or anything else of interest to K-12 educators or students. The infographic could have been intended to inform or persuade.  I provided the entrants with the background image to use for the infographic.


To find out more about infographics, visit my infographics page here: http://www.schrockguide.net/infographics-as-an-assessment.html


CREATING THE MINI-INFOGRAPHIC


The easiest way to create a mini-infographic is to create a single slide in PowerPoint, Keynote, or Google Slides.  For this contest, I had created a PowerPoint, Keynote, and JPEG version of the background entrants were required to use. The background illustrated the "clean" desk teachers would have by using an HP EliteDesk 800 G1 Mini PC!


On that single slide/image, entrants had to add the text and data information, and include the citation to the sources used for their infographic information. All of that information had to be that single slide. Here is a sample I created:


When entrants were finished with the slide, in PowerPoint they picked FILE- SAVE AS PICTURES, in Keynote picked FILE-EXPORT TO- IMAGES, and in Google Slides picked FILE- DOWNLOAD AS- JPEG IMAGE. They saved the image to their desktop or Google Drive (or their Camera Roll or Gallery if they were using a tablet).

Entrants emailed the single JPEG image to me at kathy@kathyschrock.net. They also put "Mini" in the subject line of the email and their name, email address, and Twitter handle (if they had one) in the body of the email.


Here were the links to the background image in the three different formats


REVIEW


Educators had to locate some small bit of data they wanted to share with other educators or students. Using the background on the single slide, they added --

  • a title for the infographic
  • a labeled chart or graph
  • text to explain what the viewer is seeing
  • URL to the page(s) where they obtained the data
  • Saved the slide as JPEG to their computing device
  • Sent the JPEG as an attachment to kathy@kathyschrock.net with the subject of "Mini"
  • Included their name, email address, and Twitter handle, if they had one, in the body of the email
The contest was open to PreK-16 educators and pre-service and graduate education students in the United States and Canada.

By submitting the mini-infographic entry, entrants had a random chance to win the HP EliteDesk 800 G1 Mini PC and they were giving me permission to possibly post your infographic on my blog site whether they won or not. Their name would not appear on the Web page, just the mini-infographic itself.


By submitting the entry, if they were chosen as the winner, they were are also allowing me to share their name, email address, and mailing address with HP (or an HP associate) so they could send the winner  the HP EliteDesk 800 G1 Mini PC.


The winner’s name would be announced on the blog (but not tied to their submission) and on Twitter.


The email address of all who submit entries will remain private except for the winner, whose email address will be shared with HP (or an HP associate).

The submissions were due on: December 7, 2014 by 11:59 PM Eastern Time and the contest is now closed.

UPDATE DECEMBER 8, 2014


SUBMITTED INFOGRAPHICS


Here are some of the great mini-infographics that were submitted! Thank you to all who re-tweeted about the contest and for those that submitted an entry!


THE WINNER

The randomly-chosen winner of the giveway of the HP EliteDesk 800 G1 Mini PC was Mark Case! I used the DecideNow app on the iPad to pick the winner-- congrats to Mark!